by Hans D. Stroo on February 18, 2015
Onroad vehicles are a huge part of daily life. Everyday, Washington State transports children to school, adults to work, and goods to domestic & international markets. Cars, trucks, bicycle, motorcycles, transit, fleets, and pedestrians all must share the road safely.
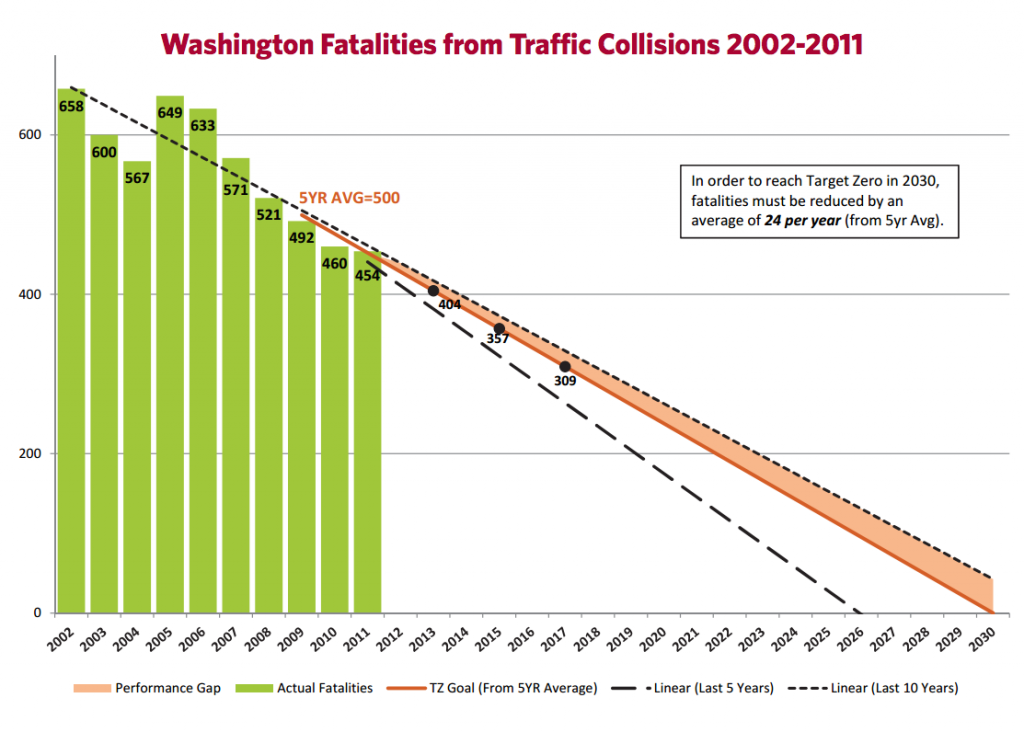
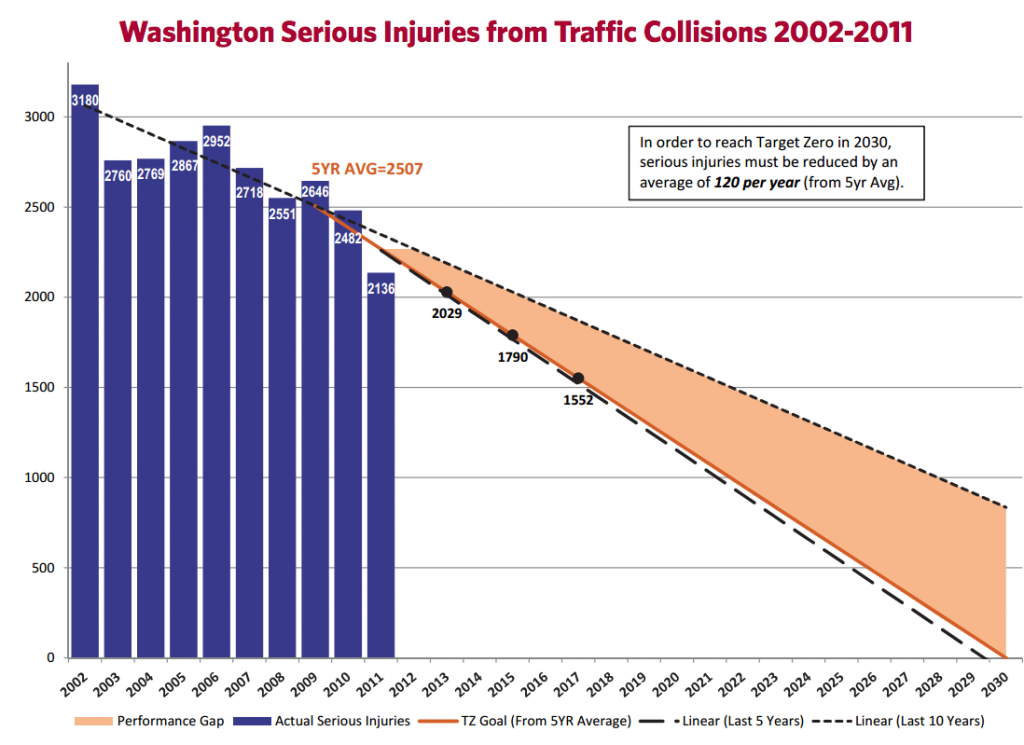
In the year 2000, the Washington Traffic Safety Commission set an aggressive goal: zero traffic fatalities or serious injuries by the year 2030. The progress has been significant, but the state will need to increase the rate of improvement significantly to meet the Target Zero goal.
Governments collect so much data on driving habits. Let’s dive into it and see what Washington’s road safety numbers look like up close!
Drivers on Washington State roads are a little safer than the typical U.S. driver. In fact, Washington ranked as the 4th best state for lowest number of driving deaths per vehicle mile traveled (VMT). For 2013, the national traffic fatality rate was 1.1 deaths per 100 million vehicle miles travelled VMT. That’s about 45 percent higher than the state rate of 0.76 deaths per 100 million VMT.
In 2013, Washington State residents drove about 8,170 miles per capita. America as a whole drove about 15 percent more at 9,320 miles per capita. Washington State ranks 7th for lowest VMT per capita. Consistent with the national trend, Washington VMT per capita was down about 169 miles from 2011. Whether total VMT rises or falls will play a big role in how Washington State’s transportation funding dilemma shakes out.
The data in this article was largely sourced from the Washington Traffic Safety Commission’s 2013 Annual Collision Summary. The Commission says that the 2014 version will be published in May 2015.
 In 2013, Washington State saw plenty of carnage on the road:
- A crash occurred every 5 minutes.
- A person was injured in a crash every 12 minutes.
- An inattentive or distracted driver is involved in a crash every 15 minutes.
- A speeding drivers is involved in a crash every 30 minutes.
- A person died in a crash every 20 hours.
- A pedestrian or bicyclist was in a crash every 3 hours.
- A person is killed by an impaired driver every 2 days.
Fatal & serious injury collisions during holidays (2009-2013)
WA: Safe Roads, Minimal Driving
Insurance Institute for Highway Safety, Highway Loss Data Institute, General Statistics, 2013.
WASHINGTON STATE ROAD SAFETY BY THE NUMBERS:
- 6,156,835 registered passenger vehicles.
- 57.2 billion VMT.
- 440,780 speeding citations filed with WA courts.
- 39,478 cell phone and texting citation filed.
- 31,724 DUI and/or physical control of the vehicle while under the influence of alcohol and/or drugs cases filed.
- 5,211,033 licensed drivers
- The highest number of crashes occurred on Saturdays; the least occurred on Mondays.
- The most crashes occurred from 5:00-5:59 pm; the least occurred from 4:00-4:59 am.
- The most crashes occurred in November (315 per day); the least occurred in February (237 per day).
NO SHORTAGE OF FENDER BENDERS IN KING COUNTY
BUT SERIOUS ACCIDENTS WERE CONCENTRATED ELSEWHERE.
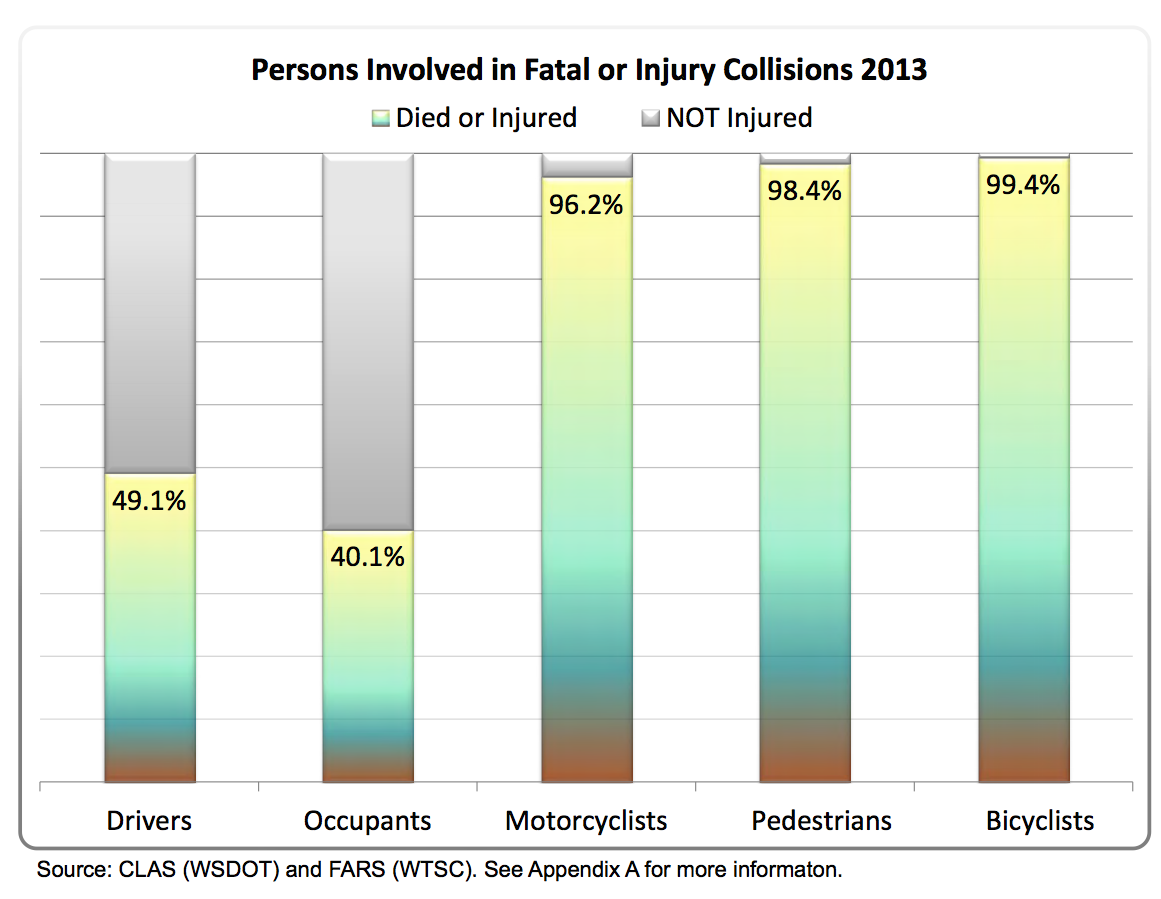
WHAT CAUSES ACCIDENTS?
Distraction/inattention most common contributing factor behind collisions. Alcohol/drugs were a factor in half of all fatal collisions.
Washington Traffic Safety Commission, 2013 Annual Collision Summary.