Summary
Using a proprietary modeling system, the Washington Business Alliance analyzed the expected outcomes of Senator Palumbo’s Carbon Tax Bill, Senate Bill 5930. SB 5930 is projected to generate a peak of roughly $1.8 billion/year in 2024 (in USD, 2018), and reduce greenhouse gas emissions by a similar amount as the Clean Air Rule (CAR): around 180 million metric tons of carbon dioxide equivalents (MtCO2e) give or take around twenty percent. Emissions in 2035 are projected to be around 9% lower than 1990 levels. The Washington Business Alliance will continue to refine these estimates and provide timely, data-driven reports as bill details emerge, including careful modeling of the Carbon Reduction Fund impacts.
WAShington State Greenhouse Gas Reduction Explorer
The Business Alliance recognizes that effective policy design requires the ability to forecast expected outcomes. The Business Alliance’s driving mission, through Plan Washington, is to Unlock Our State’s PotentialLow Carbon Prosperity Initiative is a primary component of Plan Washington that prioritizes reducing carbon emissions while achieving vigorous economic growth. To that end, the Business Alliance developed the Washington State GHG Reduction Explorer to analyze various policy proposals involving greenhouse gas emissions. This proprietary software is based on the Carbon Tax Assessment Model (CTAM) maintained by the Washington State Energy Office. The model incorporates slight modifications to CTAM, and adds functionality to consider the impact on greenhouse gas emissions and revenue collection of dedicating revenue to invest in carbon reduction projects. Without a reinvestment mechanism, the GHG reduction potential of a tax is limited to the motivational deterrent of higher prices on fossil fuel consumption The model provides the capability to incorporate the Department of Ecology’s Clean Air Rule (CAR), considering overlap between emissions reductions achieved with the simultaneous implementation of CAR and a carbon price. The Departments of Commerce and Ecology evaluated the model and its assumptions, its validity and usefulness to estimate outcomes. The Business Alliance also provided reports on SB 5385 (Hobbs) and HB 1646 (Fitzgibbon).
GHG Reduction Explorer user interface allows policy design considerations to be quickly and cleanly evaluated, both individually and in aggregate. These include: whether or not Ecology’s Clean Air Rule cap is in effect; the starting year for a carbon tax and the initial price charged per metric ton of CO2; the annual rate of tax increase above inflation; the percent of revenue reinvested in carbon reduction projects; and exemptions from the price or cap for certain sectors (petroleum producers and exporters, power producers Energy-Intensive Trade-Exposed (EITE) industries, other non-EITE industries, and local natural gas distribution companies). Beyond the user interface, additional functionality is available to model scenarios with more fine-grained details.
The model provides range of outputs that are tightly and responsively linked to the user inputs described above. These include: Cumulative and annual GHG reductions over time, the impact on the price of commonly purchased units of energy (gallon of gasoline, kWh of electricity, therm of natural gas), the net revenue collected, and the ratio of revenue collected to greenhouse gas emissions reduced beyond the baseline projection.
Beyond these features, the Business Alliance continues to refine and expand Explorer capability. Currently, an economic module for exploring household level, county-by-county impacts is under development to provide an important, decentralized perspective on the upfront cost impacts of any carbon pricing proposals The GHG Reduction Explorer is also readily adaptable to other states, an opportunity the Washington Business Alliance is actively pursuing.
To request a demo of the Explorer, inquire about running customized policy scenarios, or for more information please contact: Colleen McAleer ( President, Colleen@wabusinessalliance.org, (206) 441-5101) or Isaac Kastama (Government Affairs, isaac@wabusinessalliance.org, (253) 232-5313)
Overview of Senator Palumbo’s Proposal Establishing a Carbon Pollution Tax
The carbon pollution tax in SB 5930 would apply to the sale or use of all fossil fuels within the state, starting at $15 per metric ton of carbon dioxide (tCO) as of July 1, 2018 and increase $2.50 per year to a cap of $30 per tCO2. SB 5930 would also prohibit state agencies from implementing a program for greenhouse gas emissions standard, limit, or cap – thereby prohibiting the Department of Ecoogy from enforcing the Clean Air Rule – unless authorized to do so in legislation prior to July 1, 2023.
For electricity and residential uses of natural gas, the carbon tax would phase-in from an initial rate of 25%, increasing by 25 percentage points every two years before reaching full price in 2024. Notable exemptions from the tax include: fossil fuels and electricity used on-site by energy-intensive trade exposed (EITE) manufacturing businesses, electricity imported into Washington, and agricultural aircraft fuel or diesel.
Utilities would be allowed a tax credit against 75% of the carbon tax for specified purposes, such as conservation and electrification in transportation. Among fossil fuels eligible for a full tax credit are:
- Declared resource in Washington that generates electricity with natural gas and replaces or reduces the electricity generated from an out-of-state coal plant;
- Fossil fuels purchased in state by commercial vehicles engaged in interstate or international commerce that are transported in a fuel supply tank and consumed outside the state, and;
- Evidence that qualified sequestration was used to prevent CO
Aside from the 75% tax credit for utilities (plus a cap of 3% for administrative costs) the revenue would be allocated for several purposes under a Carbon Reduction and Environmental Resiliency Account. The first $400 million per year are allocated to the Carbon Reductions Solutions Account, offsetting general funding resources for programs and freeing up money for education investments. The remaining funds in the Account are allocated to the Carbon Reduction Investment Fund (CRIF, 45%), the Water Infrastructure Account (20%), the Forest Resilience and Fire Suppression Account (20%), and various programs that relieve the impact of the carbon tax on low-income or vulnerable segments of the population (15%)
Projected Emissions Impact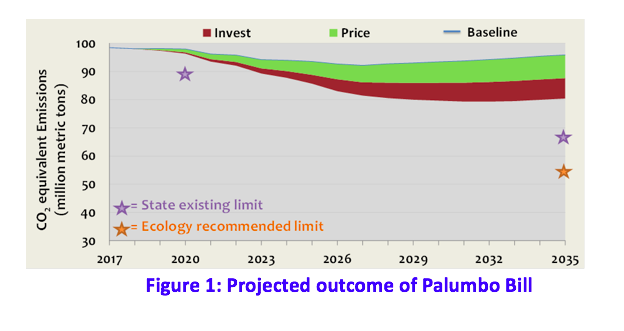
The model projects SB 5930 will reduce cumulative GHG emissions to ~180 MtCO2e below the baseline from 2018-2035 (Figure 1), and around 9% lower than 1990 levels by 2035. The two main drivers of this reduction are from the price signal impact on fuel consumption choices, and the use of revenues to Carbon Reduction Investment Fund programs and tax credit investments by utilities. This reduction is essentially equivalent to the CAR, a Rule that SB 5930 would repeal. There is uncertainty in the emissions impact estimate. A full, rigorous sensitivity analysis is beyond the scope of this summary report; however a range of +/-20% is a reasonable assumption. Certain exemptions and tax credits are difficult to completely capture with the model framework and there is additional downside risk relative to model projections, possibly -20 MtCO2e for the 2018-2035 cumulative projection.
Net new carbon reductions from the price signal response are projected to be around 100 MtCO2e from 2018-2035, approximately 55% of the emissions reductions below baseline. The remaining greenhouse gas emissions reduction are from the Carbon Reduction Investment Fund expenditures plus investment of tax credits by utilities. Achieving the 2035 state limit via SB 5930 would require some combination of not exempting imported electricity, allowing the price to increase with the rate of inflation, increasing the share of revenues to the Carbon Reduction Investment Fund beyond 45%, and further increasing the tax collected per ton of carbon dioxide.
PROJECTED REVENUE IMPACT
The total revenue from SB 5930 through 2035 is projected to be approximately $25 billion in USD, 2018, peaking at nearly $1.8 billion annually in 2024.
The revenue implications, with approximately the same +/- 20% uncertainty as described for the emissions reduction, are projected to be:
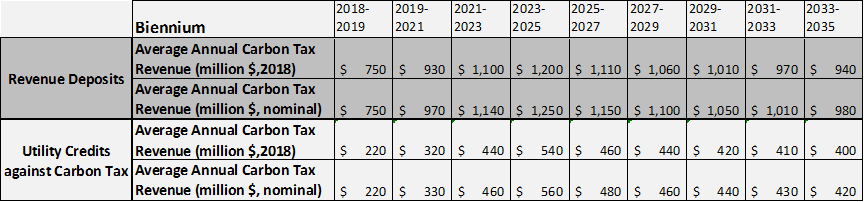
On an annual basis and by various expenditure categories, the revenues are projected to be disbursed through 2035 as shown in Figure 2:
Figure 2: Annual expenditures by spending category
Description of Key Model Assumptions
Emissions reductions are reported relative to a projected baseline. This baseline (figure 1, blue line at top of green wedge) is consistent with CTAM Version 3.2c for energy-related fossil fuel and industrial process emissions, plus an assumption of essentially flat emissions from agriculture, waste, and other emissions based on recent history. The baseline used here is somewhat higher than the baseline assumed by the Department of Ecology through 2035. A lower baseline would likely result in less revenues collected and cumulative emissions reduced. At the same time, a lower baseline places a less stringent requirement on new policies to comply with statutory limits through 2035.
In developing estimates of emissions reductions and revenues associated with SB 5930, the following model parameters were assumed:
- Exemptions are in place for Energy-Intensive Trade-Exposed industries (EITEs) and “coal-by-wire”, while phase-ins (25% in 2018-19, 50% in 2020-21, 75% 2022-23, 100% from 2024 onwards) are applied to all other power and residential natural gas.
- Investments and Cost-Effectiveness
- utilities, including natural gas LDCs, it is assumed that 85% of the tax revenue is invested in carbon reducing projects (75% through tax credits that must be reinvested in conservation, transportation electrification, etc. and another 10% (45% of the remaining 25%) directed to the Carbon Reduction Investment Fund or CRIF). The average cost-effectiveness of these revenues starts at $143/tCO2e ($100/tCO2e to projects with a system efficiency of 70%) and decreases steadily to $66/tCO2e by 2035 ($60/tCO2e to projects with a 90% system efficiency) as project economics and system efficiency at identifying emissions reducing projects that are additional and real improves. Investments pay for an average 10-year lifetime of greenhouse gas reductions, although the mechanism is not prescribed by the model.
- petroleum products, 45% of the revenue after $400 million is set aside for the Carbon Solutions Account goes to the CRIF. The average cost-effectiveness of CRIF starts at $71/tCO2e ($50/tCO2e to project with a system efficiency of 70%) and decreases steadily to $33/tCO2e by 2035 ($30/tCO2e to projects with a 90% system efficiency) as project economics and system efficiency at identifying emissions reducing projects that are additional and real improves. Investments pay for an average 10-year lifetime of greenhouse gas reductions. Investments pay for an average 10-year lifetime of greenhouse gas reductions, although the mechanism is not prescribed by the model.
For more information please contact:
Colleen McAleer, President Colleen@wabusinessalliance.org (206) 441-5101
or Isaac Kastama, Government Affairs isaac@wabusinessalliance.org (253) 232-5313