Summary
Using our proprietary Washington State Greenhouse Gas (GHG) Reduction Explorer, the Washington Business Alliance analyzed the expected outcome of Senate Bill 6203 out to 2035. The bill is projected to generate roughly $900 million per year (in USD, 2020) in new revenue and establish an average of $460 million (USD, 2020) per year in utility tax credits, while reducing greenhouse gas emissions in excess of Statutory Limits: a cumulative 250 million metric tons of carbon dioxide equivalents (MtCO2e). We will continue to refine these estimates and provide timely, data-driven reports as details emerge, including careful modeling of Energy Transformation Account and Tax Credit impacts.
Washington State Greenhouse Gas Reduction Explorer
Effective policy design requires the ability to forecast expected outcomes. The Washington Business Alliance’s Low Carbon Prosperity focus prioritizes reducing carbon emissions while achieving vigorous economic growth. To that end, the Washington State GHG Reduction Explorer is our proprietary tool to analyze various policy proposals meant to lower greenhouse gas emissions. The GHG Reduction Explorer is based on the Carbon Tax Assessment Model (CTAM) maintained by the Department of Commerce’s Washington State Energy Office. The model incorporates slight modifications to CTAM, adding functionality to consider the impact on greenhouse gas emissions and revenue collection of dedicating revenue to invest in carbon reduction projects. The GHG Reduction Explorer user interface allows policy design considerations to be quickly and cleanly evaluated, both individually and in aggregate, and provides a range of outputs that are tightly and responsively linked to user inputs. Without a reinvestment mechanism, the GHG reduction potential of a tax is limited to the motivational deterrent of higher prices on fossil fuel consumption, known as price elasticity. The Departments of Commerce and Ecology evaluated the model and its assumptions, its validity and usefulness to estimate outcomes. The Business Alliance also provided reports on SB 5930 (Palumbo), SB 5385 (Hobbs) and HB 1646 (Fitzgibbon) during the 2017 session.
To request a demo of the Explorer, inquire about running customized policy scenarios, or for more information please contact: Kevin Tempest (Research & Development Scientist, kevin@wabusinessalliance.org, (206) 300-6126) or Isaac Kastama (Government Affairs, kastama@waterstreetpa.com, (253) 232-5313).
Overview of Senate Bill 6203 Relating to Reducing Carbon Pollution
The carbon pollution tax would apply to the sale or use of all fossil fuels within the state, starting at $20 per metric ton of carbon dioxide (tCO2) as of July 1, 2019 and increasing 3.5% plus inflation per year starting on January 1, 2020. Notable exemptions from the tax include: fossil fuels used on-site in energy-intensive trade exposed (EITE) facilities for manufacturing processes, coal transition power, aircraft fuel, and agricultural aircraft fuel or diesel.
Utilities (light and power business as well as gas distribution business) would be allowed a tax credit against up to 100% of the carbon tax for specified purposes, such as conservation and electrification in transportation. A minimum of 20% of the tax credit must go towards low-income assistance.
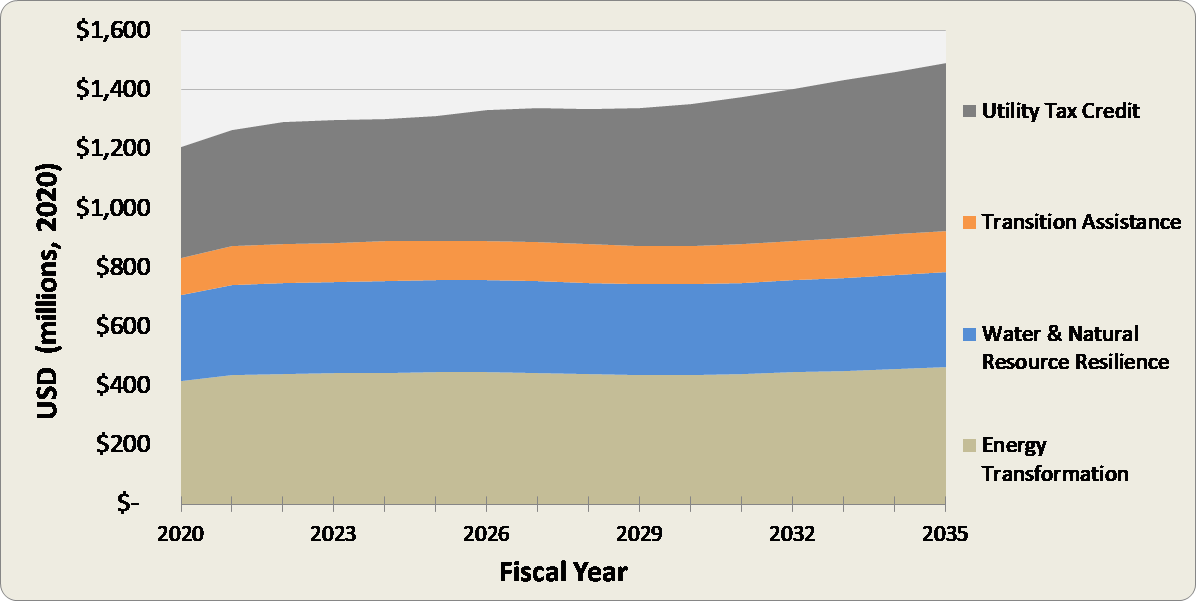
Aside from the tax credit for utilities, the revenue would be allocated for several purposes under a new Carbon Pollution Reduction Account. The funds in the Account are to be allocated to the Energy Transformation Account (50%), the Water and Natural Resources Resilience Account (35%), and the Transition Assistance Account (15%).
Projected Emissions Impact
Using the GHG Reduction Explorer, we project the bill will reduce cumulative GHG emissions roughly 250 MtCO2e below the latest CTAM baseline (version 3.3b) for 2018-2035 (Figure 1). The three main drivers of this reduction are from the price signal impact on fuel consumption choices (top/green wedge), the use of revenues in the Energy Transformation Account (middle/dark red wedge) and tax credit investments by utilities (bottom/light red wedge). Under this central projection, this reduction is enough to achieve the 2035 state existing limit (purple star), although it would not meet the Department of Ecology’s most recent recommended limit for 2035 (orange star).
There is uncertainty in the emissions impact estimate. A full, rigorous sensitivity analysis is beyond the scope of this summary report; however a range of +/-20% relative to the 250 MtCO2e projection is a reasonable starting assumption, representing a full range of 200-300 MtCO2e.
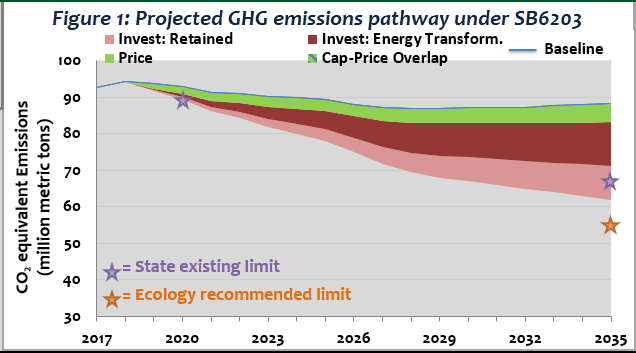
Net new carbon reductions from the price signal response are projected to be around 60 MtCO2e from 2019-2035, or approximately 25% of the emissions reductions below baseline. The bulk of the greenhouse gas emissions reduction are projected to come from the Energy Transformation Account (45% or roughly 110 MtCO2e) and the Utility Tax Credits (30% or roughly 80 MtCO2e).
Projected Revenue Impact
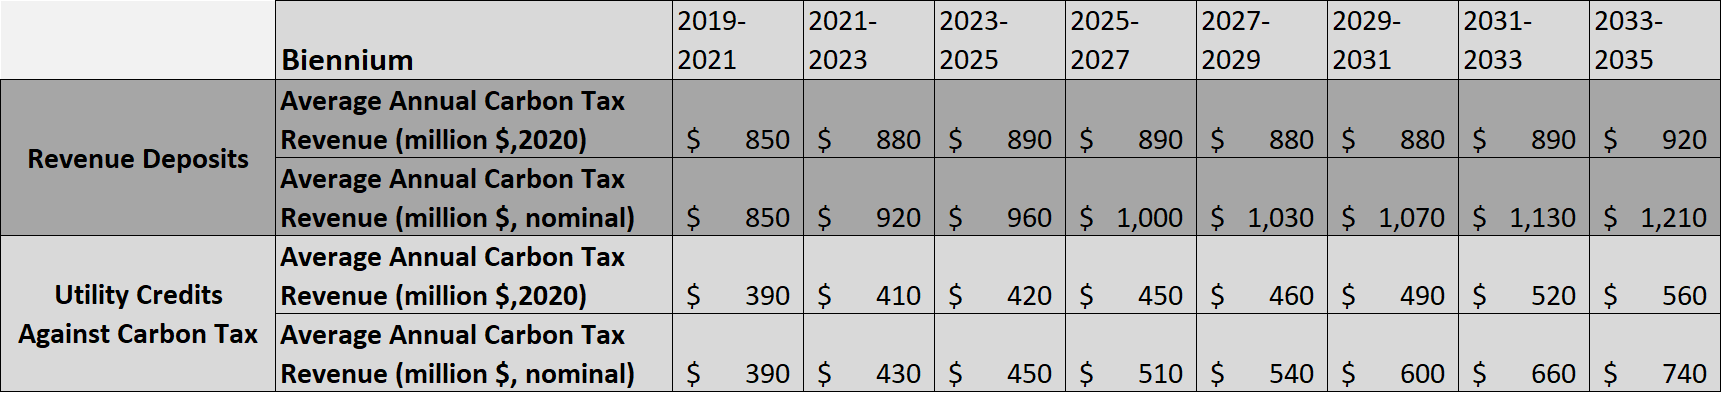
The total revenue from the tax through 2035 is projected to be nearly $15 billion in USD, 2020, with a generally steady annual flow. Utility credits against the carbon tax are projected to total nearly $7 billion over the same time period. The revenue implications, with an estimated ± 5% uncertainty, are projected at the following average annual amounts for each biennium:
On an annual basis and by various categories, expenditures are projected to be disbursed through 2035 as shown in Figure 2:
Figure 2: Annual expenditures by spending category
Projected Emissions Impact
Emissions reductions are reported relative to a projected baseline. This baseline (figure 1, blue line at top of top/green wedge) is consistent with CTAM Version 3.3b for energy-related fossil fuel and industrial process emissions, plus an assumption of flat emissions from agriculture, waste, and other emissions based on recently available history (2010-2013). The baseline used here is slightly higher than the baseline assumed by the Department of Ecology through 2035. A lower baseline would likely result in both less revenues collected and less cumulative emissions reduced, while also placing a less stringent requirement on new policies to comply with statutory limits through 2035 (and vice versa for a higher baseline).
In developing estimates of emissions reductions and revenues, the following model parameters were assumed:
- Exemptions are in place for Energy-Intensive Trade-Exposed industries (EITEs), Coal: Centralia, and Jet Fuel;
- Investments and Cost-Effectiveness:
- For tax credits retained by utilities & natural gas distributors, it is assumed that 80% of the potential tax credit is invested in carbon reducing projects, and 20% is for low-income assistance. The average cost-effectiveness of these revenues starts at $71/tCO2e (including a net system efficiency of 70%) and decreases steadily to $33/tCO2e by 2035 ($30/tCO2e to projects with a 90% system efficiency). Both project economics and system efficiency at identifying effective emissions reducing projects are assumed to improve over time. Investments pay for GHG reductions that take an average 10-years to fully return in net carbon reductions. The mechanism for investments is not prescribed by the model.
- For the Energy Transformation Account, the average cost-effectiveness is the same as above for utilities & natural gas distributors: The average cost-effectiveness of starts at $71/tCO2e ($50/tCO2e received by project with a net system efficiency of 70%), decreasing steadily to $33/tCO2e by 2035 ($30/tCO2e to projects with a 90% system efficiency). Investments pay for GHG reductions that take an average 10-years to fully return in net carbon reductions. The mechanism for investments is not prescribed by the model.
The CTAM 3.3b versions used was the November 2017 version, downloaded on December 27th.